Home Surveillance graphs

Home Security Perceived Effectiveness
This graph reveals the perceived effectiveness of at home security surveillance cameras in residential homes in 2021. The majority believes that smart home cameras are slightly effective.

Popular Surveillance Doorbell Comparison
The graph above shows the effectiveness in home surveillance cameras. As a comparison, this chart breaks down the most popular brands of at home surveillance to the Amazon Ring. Cost and storage are the major disparities between the various cameras. Alerts is the last category that is area of most concern when it comes to the push for technological advancements within the various at home cameras.
Ring Does Not Deter Property Crime

Ring partnered with police during a time when U.S. property crimes have been declining, specifically package thefts and burglaries as the graph makes aware. The effectiveness of police partnerships with Ring to deter crime is not statistically backed. Jodee Reyes at Carlsbad PD said, "We don’t have any research data showing that Ring has a correlation to a reduction. Our residential burglary rate
Amazon benefits by piggy backing off of declining property offenses in the United States to imply that Ring is helping deter crime without real evidence that it does so. The graph on the right sourced from the FBI shows otherwise.
Dallas District Crime Charts

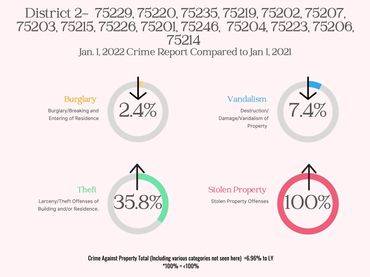
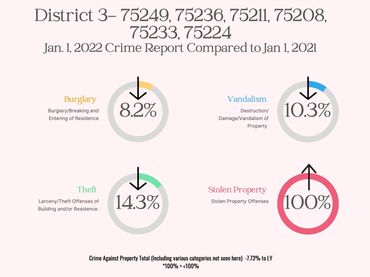

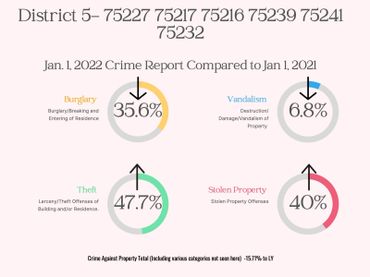

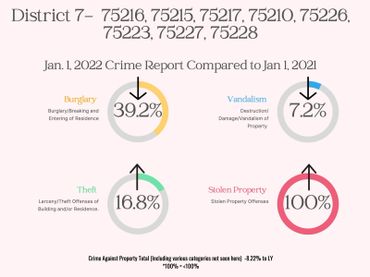
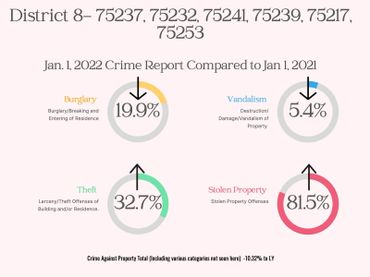
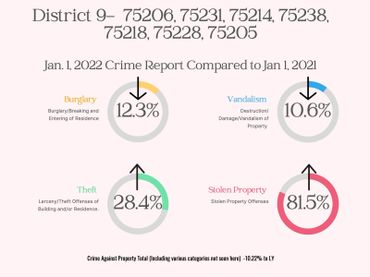
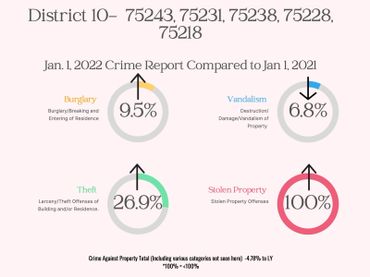
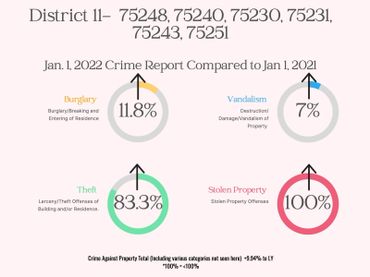
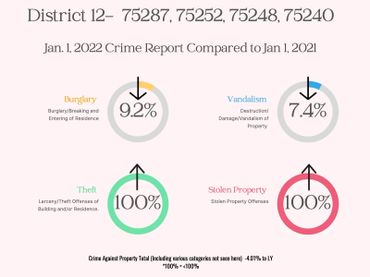
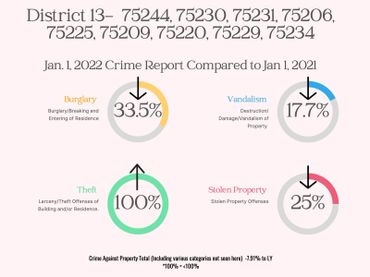
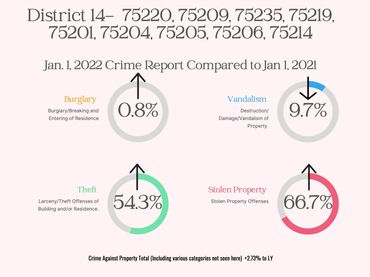
Dallas Districts Data and Demographics
This adjacent image shows the data collected from DPD open Data portal. The City divides a districts total property crime based upon the (12) various categories. Some of these categories are irrelevant to determining the overall property crime and lead me to believe the city uses filler categories to "fluff" data to use as they see fit. For my graphs above, I have excluded the filler categories
This bar graph shows the various demographics within each Dallas District. As you can see, Dallas Districts demographics are very diverse. More importantly, you can see the minority districts and compare that to the Population and Income. As the graphs make aware, the minority districts also have the lowest income aside from District 8.
Dallas Districts Crime Vs. Ring Desnity Maps

This map shows the current 14 Dallas District Map in comparison to the 2022 Highest Property Crime Districts. As the map reveals: District 11 has the highest property crime followed by District 2, District 14, District 6 and District 12. The only correlating data between the two graphs is that District 14 was third in Property Crime and third in Ring Density.
This map shows the current 14 Dallas District Map in comparison to the 2022 Ring Ownership Density. As the map reveals: District 2 has the highest Ring density followed by District 6, District 14, District 4 and District 11. The only correlating data between the two graphs is that District 14 was third in Ring Density and third in Property Crime.
Dallas Safest and Most Dangerous Neighborhoods
Safest Dallas Neighborhoods
Most Dangerous Dallas Neighborhoods
Most Dangerous Dallas Neighborhoods

Safest Neighborhoods in Dallas for 2020
1. University Park
Pop. 24,259 | Violent Crime 306 per 100K | Property Crime 1,300
*2. Highland Park
Pop. 8,797 | Violent Crime 306 per 100K | Property Crime 1,300
3. Farmers Market District
Pop. 1,688 | Violent Crime 306 per (100K) | Property Crime 1,300
4. City Center District
Pop. 1,636 | Violent Crime 306 per 100K | Property Crime 1,300
5. Main Street District
Pop. 987 | Violent Crime 306 per 100K | Property Crime 1,300
6. Government District
Pop. 850 | Violent Crime 306 per 100K | Property Crime 1,300
7. West End Historic District
Pop. 874 | Violent Crime 479 per 100K | Property Crime 2,036
8. Far North
Pop. 163,453 | Violent Crime 299 per 100K | Property Crime 2,277
9. Bluffview
Pop. 15,001 | Violent Crime 199 per 100K | Property Crime 2,815
10. Winnetka Heights
Pop. 65,571 | Violent Crime 533 per 100K | Property Crime 2,484
Districts 13, 14 and 2 had the safest neighborhoods
Compared to 2022 Highest Property Crime per Districts 11, 2, 14
Compared to 2022 Ring Ownership per Districts 2, 6, 14
*HP not included due to the zip code not included in Dallas Districts
Most Dangerous Dallas Neighborhoods
Most Dangerous Dallas Neighborhoods
Most Dangerous Dallas Neighborhoods
Most Dangerous Neighborhoods in Dallas for 2020
1. South Boulevard-Park Row
Pop. 26,359 | Violent Crime 6,492 | Property Crime 3,255
2. Cedar Crest
Pop 63,686 | Violent Crime 3,751 | Property Crime 1,724
3. South Dallas
Pop 28,901 | Violent Crime 4,920 | Property Crime 1,717
4. Convention Center District
Pop 920 | Violent Crime 9,612 | Property Crime 1,591
5. Cockrell Hill
Pop 4,240 | Violent Crime 5,097 | Property Crime 1,249
6. Northwest Dallas
Violent Crime 5,072 | Property Crime 1,243
7. Wolf Creek
Violent Crime 3,757 | Property Crime 1,229
8. Oak Cliff
Violent Crime 3,952 | Property Crime 1,113
9. Urbandale-Parkdale
Violent Crime 4,044 | Property Crime 1,082
10. Eagle Ford
Violent Crime 3,750 | Property Crime 979
Districts 7, 4, 1, 2 had the most dangerous neighborhoods
Compared to 2022 Highest Property Crime per Districts 11, 2, 14
Compared to 2022 Ring Ownership per Districts 2, 6, 14
Dallas District Maps and Redistricting Maps


Dallas 2023 redistricting map shows new boundaries. Blacks & Latinos worry this dilutes voting power, neighborhoods, diminish cultural historical ties
2022 Current Surveillance Graphs
Dallas Steps to Add Surveillance
Ring Security and Privacy Concerns
Dallas Steps to Add Surveillance

DPD Plan to Reduce Crime
Ring Security and Privacy Concerns
Dallas Steps to Add Surveillance
Ring Security and Privacy Concerns
Ring Security and Privacy Concerns
Ring Security and Privacy Concerns